Matplotlib 图形元素参考#
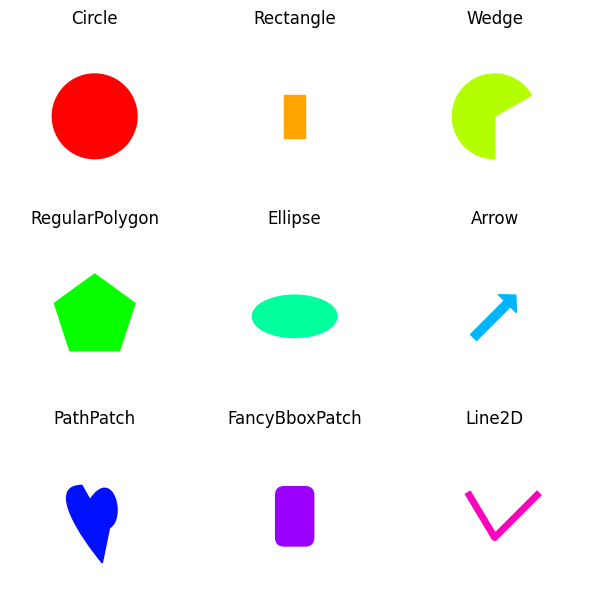
这个示例展示了 Matplotlib 的几个图形基本元素(图形元素(artists))。完整的图形元素列表在 artist-api 中有文档记录。
另见 patch_collection,它将所有图形元素组合成 PatchCollection。
import matplotlib.pyplot as plt

import matplotlib as mpl
import matplotlib.lines as mlines
import matplotlib.patches as mpatches
import matplotlib.path as mpath

# Prepare the data for the PathPatch below.
Path = mpath.Path
codes, verts = zip(*[
    (Path.MOVETO, [0.018, -0.11]),
    (Path.CURVE4, [-0.031, -0.051]),
    (Path.CURVE4, [-0.115, 0.073]),
    (Path.CURVE4, [-0.03, 0.073]),
    (Path.LINETO, [-0.011, 0.039]),
    (Path.CURVE4, [0.043, 0.121]),
    (Path.CURVE4, [0.075, -0.005]),
    (Path.CURVE4, [0.035, -0.027]),
    (Path.CLOSEPOLY, [0.018, -0.11])])

artists = [
    mpatches.Circle((0, 0), 0.1, ec="none"),
    mpatches.Rectangle((-0.025, -0.05), 0.05, 0.1, ec="none"),
    mpatches.Wedge((0, 0), 0.1, 30, 270, ec="none"),
    mpatches.RegularPolygon((0, 0), 5, radius=0.1),
    mpatches.Ellipse((0, 0), 0.2, 0.1),
    mpatches.Arrow(-0.05, -0.05, 0.1, 0.1, width=0.1),
    mpatches.PathPatch(mpath.Path(verts, codes), ec="none"),
    mpatches.FancyBboxPatch((-0.025, -0.05), 0.05, 0.1, ec="none",
                            boxstyle=mpatches.BoxStyle("Round", pad=0.02)),
    mlines.Line2D([-0.06, 0.0, 0.1], [0.05, -0.05, 0.05], lw=5),
]

axs = plt.figure(figsize=(6, 6), layout="constrained").subplots(3, 3)
for i, (ax, artist) in enumerate(zip(axs.flat, artists)):
    artist.set(color=mpl.colormaps["hsv"](i / len(artists)))
    ax.add_artist(artist)
    ax.set(title=type(artist).__name__,
           aspect=1, xlim=(-.2, .2), ylim=(-.2, .2))
    ax.set_axis_off()
plt.show()

参考


