内联变量评估(eval)#
Added in version 0.15.0.
eval 子模块允许您将代码变量直接插入到文档的文本流中。
使用 eval 需要将 笔记本执行模式 设置为 inline,因为变量是由笔记本内核评估的。例如,使用 top-matter:
---
file_format: mystnb
kernelspec:
  name: python3
mystnb:
    execution_mode: 'inline'
---
基本示例#
下面我们在代码单元格中设置变量 v1。
v1 = "My variable"
使用 eval 角色,可以将变量 v1 插入到段落文本中:
{eval}`v1` -> My variable
如果更新变量,可以看到后续评估中的变化:
v1 = "My new variable"
{eval}`v1` -> My new variable
重要
变量名称必须匹配正则表达式 [a-zA-Z][a-zA-Z0-9_]*
插入不同的输出类型#
任何变量类型都可以使用 eval 角色插入到文本流中,并且将根据输出格式使用最合适的输出类型(有关更多信息,请参阅 输出 MIME 优先级)。例如:
import ipywidgets as widgets
slider = widgets.IntSlider(value=5, min=0, max=10)
内联滑块({eval}`slider`):
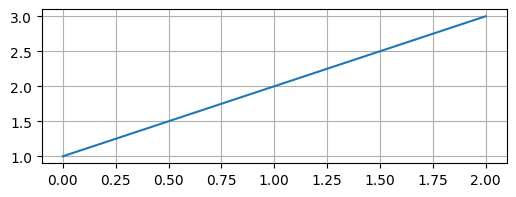
您还可以使用 eval 指令将变量作为块插入:
import matplotlib.pyplot as plt
myplot, ax = plt.subplots(figsize=(6, 2))
mean = 2.0
ax.plot([1,2,3])
ax.grid()
plt.close()
使用:
```{eval} myplot
```
给定:

在图表中嵌入输出#
eval:figure 指令允许您在图表中嵌入输出,并提供可选的标题和其他格式化选项。
例如,可以将上述图的输出嵌入到图表中:
```{eval:figure} myplot
:name: myplot
My plot with a mean value of {eval}`mean`.
```
这将生成:

My plot with a mean value of 2.0.#
可以使用 {ref}`myplot` 引用它:My plot with a mean value of 2.0.
以下指令选项可用:
Option |
Type |
Description |
|---|---|---|
figwidth |
length or percentage |
The width of the figure |
figclass |
text |
A space-separated list of class names for the figure |
name |
text |
referenceable label for the figure |
alt |
text |
Alternate text of an image |
height |
length |
The desired height of an image |
width |
length or percentage |
The width of an image |
scale |
percentage |
The uniform scaling factor of an image |
class |
text |
A space-separated list of class names for the image |
align |
text |
left, center, or right |
