保存变量以嵌入(glue)#
glue 子模块允许您通过键将变量存储在笔记本输出中,然后引用这些键以将输出嵌入到文本内容中。[1]
在 0.14.0 版本发生变更: 默认情况下,glue 角色和指令现在仅识别同一笔记本中的键。要从其他笔记本中粘贴键,请参阅 从其他页面嵌入输出。
在代码单元格中保存变量#
您可以使用 myst_nb.glue() 将变量的输出分配给您选择的键。glue 将存储通常用于显示该变量的所有信息(即,当您通过将变量放在单元格末尾来显示它时发生的任何情况)。选择您会记住的键,因为您稍后将使用它。
以下代码将变量粘贴到笔记本中:
from myst_nb import glue
a = "my variable!"
glue("my_variable", a)
'my variable!'
You can then insert it into your text like so: 'my variable!'.
这是通过以下代码实现的: {glue}`my_variable`。
保存不同类型的变量#
您可以在笔记本中粘贴任何内容,并使用 {glue} 稍后显示。这里展示如何粘贴和显示 数字和图像。将模拟一些数据并对其运行简单的引导程序。将隐藏此过程的大部分内容,以专注于粘贴部分。
Show code cell content
# Simulate some data and bootstrap the mean of the data
import numpy as np
np.set_printoptions(legacy="1.25")

import pandas as pd
import matplotlib.pyplot as plt

n_points = 10000
n_boots = 1000
mean, sd = (3, .2)
data = sd*np.random.randn(n_points) + mean
bootstrap_indices = np.random.randint(0, n_points, n_points*n_boots).reshape((n_boots, n_points))
在下面的单元格中,data 包含我们的数据,bootstrap_indices 是每次引导程序中的样本索引集合。下面将计算一些感兴趣的统计量,并将它们 glue() 到笔记本中。
# Calculate the mean of a bunch of random samples
means = data[bootstrap_indices].mean(0)
# Calculate the 95% confidence interval for the mean
clo, chi = np.percentile(means, [2.5, 97.5])

# Store the values in our notebook
glue("boot_mean", means.mean())
glue("boot_clo", clo)
glue("boot_chi", chi)
2.9988185554092586
2.986066929882158
3.0110419771934813
默认情况下,glue 会显示您正在粘贴的变量的值。这对于在粘贴时检查其值很有用。如果您想 阻止显示,请使用 display=False 选项。请注意,下面我们还 覆盖 了 boot_chi 的值(但使用相同的值):
glue("boot_chi_notdisplayed", chi, display=False)
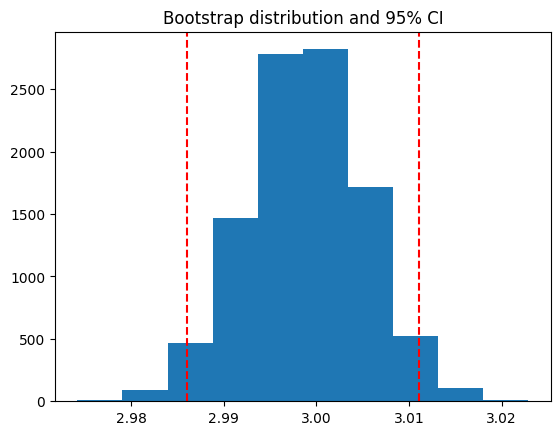
您还可以粘贴可视化内容,例如 matplotlib 图形(这里我们使用 display=False 来确保图形不会绘制两次):
# Visualize the histogram with the intervals
fig, ax = plt.subplots()
ax.hist(means)
for ln in [clo, chi]:
    ax.axvline(ln, ls='--', c='r')
ax.set_title("Bootstrap distribution and 95% CI")

# And a wider figure to show a timeseries
fig2, ax = plt.subplots(figsize=(6, 2))
ax.plot(np.sort(means), lw=3, c='r')
ax.set_axis_off()

glue("boot_fig", fig, display=False)
glue("sorted_means_fig", fig2, display=False)


同样,也可以对 DataFrame(或其他类似表格的对象)执行此操作。
bootstrap_subsets = data[bootstrap_indices][:3, :5].T
df = pd.DataFrame(bootstrap_subsets, columns=["first", "second", "third"])
glue("df_tbl", df)
| first | second | third | |
|---|---|---|---|
| 0 | 2.899050 | 2.957541 | 3.146866 |
| 1 | 3.151724 | 3.420575 | 2.792819 |
| 2 | 2.852166 | 2.937019 | 3.040852 |
| 3 | 3.084826 | 2.844581 | 3.239955 |
| 4 | 2.948515 | 3.047301 | 2.958484 |
小技巧
由于稍后将在文档中粘贴此图,可能希望使用 remove-output 标签删除此处的输出(请参阅 移除单元格的部分内容)。
在页面中嵌入变量#
一旦您将变量粘贴到笔记本中,您就可以 粘贴 这些变量到您书中任何地方的文本中(甚至在其他页面上)。这些变量可以使用 glue: 系列 中的角色或指令进行粘贴。
glue 角色/指令#
最简单的角色和指令是 glue (也称为 glue:any),它们分别将粘贴的输出内联或作为块粘贴,没有额外的格式化。只需添加:
```{glue} your-key
```
例如,将使用以下文本粘贴上面生成的图:
```{glue} boot_fig
```
以下是它的样子:

或者可以像这样粘贴内联对象:
Inline text; {glue}`boot_mean`, and figure; {glue}`boot_fig`.
Inline text; 2.9988185554092586, and figure;  .
.
小技巧
We recommend using wider, shorter figures when plotting in-line, with a ratio
around 6x2. For example, here's is an in-line figure of sorted means
from our bootstrap:  .
It can be used to make a visual point that isn't too complex! For more
ideas, check out how sparklines are used.
接下来,将介绍一些更具体的粘贴功能,这些功能可以让您更好地控制输出在页面中的显示方式。
控制输出格式#
您可以使用 {glue} 的子命令来控制粘贴的输出。这些子命令的调用方式如下:{glue:subcommand}`key`。这些子命令允许您更好地控制粘贴输出的外观、感觉和内容。
小技巧
当您使用 {glue} 时,实际上是在使用 {glue:any} 的简写形式。这是通用命令,不会对您粘贴的内容做出太多假设。
glue:text 角色#
glue:text 角色专门用于 text/plain 输出。例如,以下文本:
The mean of the bootstrapped distribution was {glue:text}`boot_mean` (95% confidence interval {glue:text}`boot_clo`/{glue:text}`boot_chi`).
渲染为:
The mean of the bootstrapped distribution was 2.9988185554092586 (95% confidence interval 2.986066929882158/3.0110419771934813)
备注
glue:text 仅适用于包含 text/plain 输出的粘贴变量。
使用 glue:text,我们可以通过在 : 后指定格式字符串来为输出添加格式化:{glue:text}`mykey:<format_spec>`
<format_spec> 应该是有效的 Python 格式说明符。
这在显示数字并希望四舍五入结果时特别有用。例如,以下内容:My rounded mean: {glue:text}`boot_mean:.2f` 将呈现如下:
My rounded mean: 3.00 (95% CI: 2.99/3.01).
警告
从 NumPy 2.0 开始,NumPy 对象的 text/plain 表示已更改。使用 NumPy>=2.0 的文本格式化将给出如下警告:
sphinx.errors.SphinxWarning: <filename>:257:Failed to format text/plain data: could not convert string to float: 'np.float64(0.9643970836113095)' [mystnb.glue]
这可以通过在粘贴之前格式化数字或通过设置 NumPy 使用旧版打印选项来解决,如下所示。
var = np.float(1.0)
# Format the variable before glueing
glue("var_glue", f"{var:.2f}")

# Or set NumPy legacy print options
np.setprintoptions(legacy="1.25")
glue("var_glue", var)
glue:figure 指令#
使用 glue:figure,您可以对类似图形的对象应用更多格式化,例如为它们添加标题和可引用标签:
Option |
Type |
Description |
|---|---|---|
alt |
text |
Alternate text of an image |
height |
length |
The desired height of an image |
width |
length or percentage |
The width of an image |
scale |
percentage |
The uniform scaling factor of an image |
class |
text |
A space-separated list of class names for the image |
figwidth |
length or percentage |
The width of the figure |
figclass |
text |
A space-separated list of class names for the figure |
align |
text |
left, center, or right |
name |
text |
referenceable label for the figure |
```{glue:figure} boot_fig
:alt: "Alternative title"
:figwidth: 300px
:name: "fig-boot"

This is a **caption**, with an embedded `{glue:text}` element: {glue:text}`boot_mean:.2f`!
```

This is a caption, with an embedded {glue:text} element: 3.00!#
Here is a {ref}`reference to the figure <fig-boot>`
这里是 对图形的引用
这是表格:
```{glue:figure} df_tbl
:figwidth: 300px
:name: "tbl:df"

A caption for a pandas table.
```
| first | second | third | |
|---|---|---|---|
| 0 | 2.899050 | 2.957541 | 3.146866 |
| 1 | 3.151724 | 3.420575 | 2.792819 |
| 2 | 2.852166 | 2.937019 | 3.040852 |
| 3 | 3.084826 | 2.844581 | 3.239955 |
| 4 | 2.948515 | 3.047301 | 2.958484 |
A caption for a pandas table.#
glue:math 指令#
glue:math 指令专门用于 LaTeX 数学输出(包含 text/latex MIME 类型的粘贴变量),其工作方式类似于 Sphinx 数学指令。
Option |
Type |
Description |
|---|---|---|
nowrap |
flag |
Prevent any wrapping of the given math in a math environment |
class |
text |
A space-separated list of class names |
label or name |
text |
referenceable label for the figure |
import sympy as sym
f = sym.Function('f')
y = sym.Function('y')
n = sym.symbols(r'\alpha')
f = y(n)-2*y(n-1/sym.pi)-5*y(n-2)
glue("sym_eq", sym.rsolve(f,y(n),[1,4]))
Insert the equation here:

```{glue:math} sym_eq
:label: eq-sym
```

Which we reference as Equation {eq}`eq-sym`
Insert the equation here:
Which we reference as Equation (1).
备注
glue:math 仅适用于包含 text/latex 输出的粘贴变量。
glue:md 角色/指令#
使用 glue:md,您可以输出 text/markdown,它将集成到您的页面中。
from IPython.display import Markdown
glue("inline_md", Markdown(
  "inline **markdown** with a [link](glue/main), "
  "and a nested glue value: {glue}`boot_mean`"
), display=False)
glue("block_md", Markdown("""
#### A heading

Then some text, and anything nested.

```python
print("Hello world!")
```
"""
), display=False)
markdown 格式可以指定为:
commonmark(默认):限制为 CommonMark 规范。gfm:限制为 GitHub 风格的 Markdown。注意,这需要安装 linkify-it-py 包
myst: 当前文档的 MyST 解析器配置。
例如,以下角色/指令将粘贴内联/块 MyST Markdown,就像它是原始文档的一部分一样。
Here is some {glue:md}`inline_md:myst`!

```{glue:md} block_md
:format: myst
```
Here is some inline markdown with a link, and a nested glue value: 2.9988185554092586!
A heading
Then some text, and anything nested.
print("Hello world!")
从其他页面嵌入输出#
某些 glue 角色和指令可以通过指定(相对)路径来粘贴其他笔记本中的内容。
小技巧
有时您可能希望使用不打算向用户显示的笔记本中的变量。在这种情况下,您应该将笔记本与其他内容页面一起打包,但在笔记本的元数据中包含 orphan: true。
例如,以下示例从 孤立的笔记本 粘贴了 glue 变量:
- A cross-pasted `any` role: {glue}`orphaned_nb.ipynb::var_text`
- A cross-pasted `text` role: {glue:text}`orphaned_nb.ipynb::var_float:.2E`

A cross-pasted `any` directive:

```{glue} var_text
:doc: orphaned_nb.ipynb
```
交叉粘贴的
any角色:'My orphaned variable!'交叉粘贴的
text角色:3.33E-01
交叉粘贴的 any 指令:
'My orphaned variable!'
高级用例#
以下是 glue 子模块的一些更具体和高级的用法。
嵌入到表格中#
除了粘贴输出块或与文本内联粘贴外,您还可以直接粘贴到表格中。这使您能够使用在其他笔记本中生成的输出来组合复杂的结构化数据集合。例如,以下表格:
| name                            |       plot                  | mean                      | ci                                                 |
|:-------------------------------:|:---------------------------:|---------------------------|----------------------------------------------------|
| histogram and raw text          | {glue}`boot_fig`           | {glue}`boot_mean`        | {glue}`boot_clo`-{glue}`boot_chi`                |
| sorted means and formatted text | {glue}`sorted_means_fig`   | {glue:text}`boot_mean:.3f`| {glue:text}`boot_clo:.3f`-{glue:text}`boot_chi:.3f`|
结果如下:
name |
plot |
mean |
ci |
|---|---|---|---|
histogram and raw text |
|
2.9988185554092586 |
2.986066929882158-3.0110419771934813 |
sorted means and formatted text |
|
2.999 |
2.986-3.011 |
