Jupyter 笔记本
Contents
Jupyter 笔记本#
你也可以用 Jupyter 笔记本创建内容,使用 MyST-NB Sphinx 插件。
这个页面展示了与这个主题有关的一些额外功能。
Markdown + notebooks#
由于它是 Markdown,你可以在你的文章中嵌入图片、HTML 等。

你也可以用 \(add_{math}\) 和
或
But make sure you $Escape $your $dollar signs $you want to keep!
代码块和图像输出#
Jupyter 笔记本还可以把代码块和输出嵌入到你的书中。例如,这里有一些 Matplotlib 代码样本:
from matplotlib import rcParams, cycler
import matplotlib.pyplot as plt
import numpy as np
# Fixing random state for reproducibility
np.random.seed(19680801)

N = 10
data = [np.logspace(0, 1, 100) + np.random.randn(100) + ii for ii in range(N)]
data = np.array(data).T
cmap = plt.cm.coolwarm
rcParams['axes.prop_cycle'] = cycler(color=cmap(np.linspace(0, 1, N)))


from matplotlib.lines import Line2D
custom_lines = [Line2D([0], [0], color=cmap(0.), lw=4),
                Line2D([0], [0], color=cmap(.5), lw=4),
                Line2D([0], [0], color=cmap(1.), lw=4)]

fig, ax = plt.subplots(figsize=(10, 5))
lines = ax.plot(data)
ax.legend(custom_lines, ['Cold', 'Medium', 'Hot']);
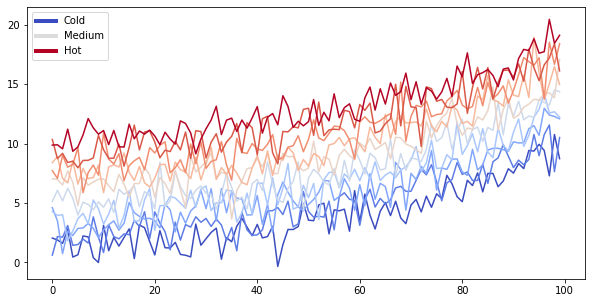
请注意,上面的图像是捕获并显示的。
print("this works for code cells too, if you add a `margin` tag to them")
this works for code cells too, if you add a `margin` tag to them
# You can also include enriched outputs like Math
from IPython.display import Math
Math("\sum_{i=0}^n i^2 = \frac{(n^2+n)(2n+1)}{6}")
在发布之前删除内容#
你也可以在向网络发布你的书之前删除一些内容。例如,在 ./notebooks.md 中,下面曾经有一个单元格 …
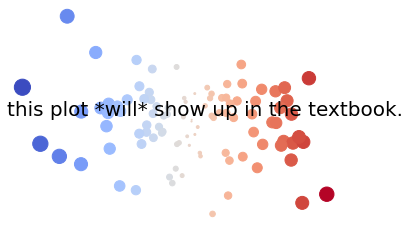
你也可以 只删除代码,这样图像和其他输出仍然显示出来。
Below we’ll only display an image. It was generated with Python code in a cell,
which you can see in the original notebook.
thisvariable = "this plot *will* show up in the textbook."

fig, ax = plt.subplots()
x = np.random.randn(100)
y = np.random.randn(100)
ax.scatter(x, y, s=np.abs(x*100), c=x, cmap=plt.cm.coolwarm)
ax.text(0, .5, thisvariable, fontsize=20, transform=ax.transAxes)
ax.set_axis_off()
And here we’ll only display a Pandas DataFrame.
import pandas as pd
df = pd.DataFrame([['hi', 'there'], ['this', 'is'], ['a', 'DataFrame']], columns=['Word A', 'Word B'])
df
| Word A | Word B | |
|---|---|---|
| 0 | hi | there |
| 1 | this | is |
| 2 | a | DataFrame |
你甚至可以为 Pandas DataFrames 设计样式!参见 Pandas 风格化文档以了解更多信息。
import pandas as pd

np.random.seed(24)
df = pd.DataFrame({'A': np.linspace(1, 10, 10)})
df = pd.concat([df, pd.DataFrame(np.random.randn(10, 4), columns=list('BCDE'))],
               axis=1)
df.iloc[3, 3] = np.nan
df.iloc[0, 2] = np.nan

def color_negative_red(val):
    """
    Takes a scalar and returns a string with
    the css property `'color: red'` for negative
    strings, black otherwise.
    """
    color = 'red' if val < 0 else 'black'
    return 'color: %s' % color

def highlight_max(s):
    '''
    highlight the maximum in a Series yellow.
    '''
    is_max = s == s.max()
    return ['background-color: yellow' if v else '' for v in is_max]

df.style.\
    applymap(color_negative_red).\
    apply(highlight_max).\
    set_table_attributes('style="font-size: 10px"')
| A | B | C | D | E | |
|---|---|---|---|---|---|
| 0 | 1.000000 | 1.329212 | nan | -0.316280 | -0.990810 |
| 1 | 2.000000 | -1.070816 | -1.438713 | 0.564417 | 0.295722 |
| 2 | 3.000000 | -1.626404 | 0.219565 | 0.678805 | 1.889273 |
| 3 | 4.000000 | 0.961538 | 0.104011 | nan | 0.850229 |
| 4 | 5.000000 | 1.453425 | 1.057737 | 0.165562 | 0.515018 |
| 5 | 6.000000 | -1.336936 | 0.562861 | 1.392855 | -0.063328 |
| 6 | 7.000000 | 0.121668 | 1.207603 | -0.002040 | 1.627796 |
| 7 | 8.000000 | 0.354493 | 1.037528 | -0.385684 | 0.519818 |
| 8 | 9.000000 | 1.686583 | -1.325963 | 1.428984 | -2.089354 |
| 9 | 10.000000 | -0.129820 | 0.631523 | -0.586538 | 0.290720 |
Testing margins before headers
交互式输出#
我们甚至可以对交互材料做同样的处理。下面我们将用 folium 来显示一张地图。当笔记本被转换为 Markdown 时,创建交互式地图的代码被保留下来”
注意,这只适用于某些软件包。它们需要能够输出独立的 HTML/Javascript,而不是依赖底层的 Python 内核来工作。
import folium
m = folium.Map(
    location=[45.372, -121.6972],
    zoom_start=12,
    tiles='Stamen Terrain'
)

folium.Marker(
    location=[45.3288, -121.6625],
    popup='Mt. Hood Meadows',
    icon=folium.Icon(icon='cloud')
).add_to(m)

folium.Marker(
    location=[45.3311, -121.7113],
    popup='Timberline Lodge',
    icon=folium.Icon(color='green')
).add_to(m)

folium.Marker(
    location=[45.3300, -121.6823],
    popup='Some Other Location',
    icon=folium.Icon(color='red', icon='info-sign')
).add_to(m)


m
笔记本单元格的富文本输出#
“因为笔记本有富文本输出,你也可以把这些存储在你的 Jupyter Book 中!”
# The ! causes this to run as a shell command
!jupyter -h
usage: jupyter [-h] [--version] [--config-dir] [--data-dir] [--runtime-dir]
               [--paths] [--json] [--debug]
               [subcommand]

Jupyter: Interactive Computing

positional arguments:
  subcommand     the subcommand to launch

optional arguments:
  -h, --help     show this help message and exit
  --version      show the versions of core jupyter packages and exit
  --config-dir   show Jupyter config dir
  --data-dir     show Jupyter data dir
  --runtime-dir  show Jupyter runtime dir
  --paths        show all Jupyter paths. Add --json for machine-readable
                 format.
  --json         output paths as machine-readable json
  --debug        output debug information about paths

Available subcommands: bundlerextension dejavu execute kernel kernelspec
migrate nbconvert nbextension notebook run server serverextension troubleshoot
trust
格式化代码单元格#
滚动单元格输出#
传统的 Jupyter 笔记本界面允许你为你的单元格切换输出滚动。这使你可以直观地看到一个长的输出的一部分,而不占用整个页面。
你可以在 Jupyter Book 中通过向单元格的元数据添加以下标签来触发这一行为:
{
    "tags": [
        "scroll-output",
    ]
}
例如,下面的单元格有很长的输出,但在书中会有滚动显示:
for ii in range(40):
    print(f"this is output line {ii}")
this is output line 0
this is output line 1
this is output line 2
this is output line 3
this is output line 4
this is output line 5
this is output line 6
this is output line 7
this is output line 8
this is output line 9
this is output line 10
this is output line 11
this is output line 12
this is output line 13
this is output line 14
this is output line 15
this is output line 16
this is output line 17
this is output line 18
this is output line 19
this is output line 20
this is output line 21
this is output line 22
this is output line 23
this is output line 24
this is output line 25
this is output line 26
this is output line 27
this is output line 28
this is output line 29
this is output line 30
this is output line 31
this is output line 32
this is output line 33
this is output line 34
this is output line 35
this is output line 36
this is output line 37
this is output line 38
this is output line 39
滚动单元格的输入#
如果你的输入代码很长,占据了页面的大部分空间,你可以通过在单元格的元数据中添加以下标签,使其也可以滚动:
{
    "tags": [
        "scroll-input",
    ]
}
例如,下面的单元格有一个很长的输入,但在书中会有滚动的功能:
b = "This line has no meaning"
b = "This line has no meaning"
b = "This line has no meaning"
b = "This line has no meaning"
b = "This line has no meaning"
b = "This line has no meaning"
b = "This line has no meaning"
b = "This line has no meaning"
b = "This line has no meaning"
b = "This line has no meaning"
b = "This line has no meaning"
b = "This line has no meaning"
b = "This line has no meaning"
b = "This line has no meaning"
b = "This line has no meaning"
b = "This line has no meaning"
b = "This line has no meaning"
b = "This line has no meaning"
b = "This line has no meaning"
b = "This line has no meaning"
b = "This line has no meaning"
print(b)
This line has no meaning